Current focus
Exit 88 Crash Risk
Police-reported crash data shows a sharp late-March and April concentration around the I-49 / AR-72 overpass. The site now includes the full past-year focus-area layer, so the recent cluster can be compared against the longer local pattern.
Dataset at a glance
Cleaned Records for Public Review
Counts are distinct crash events from the Bentonville Police transparency portal captures in this repository. Same-minute and same-coordinate ticket rows are grouped together to avoid double-counting one crash scene.
Signal for Council
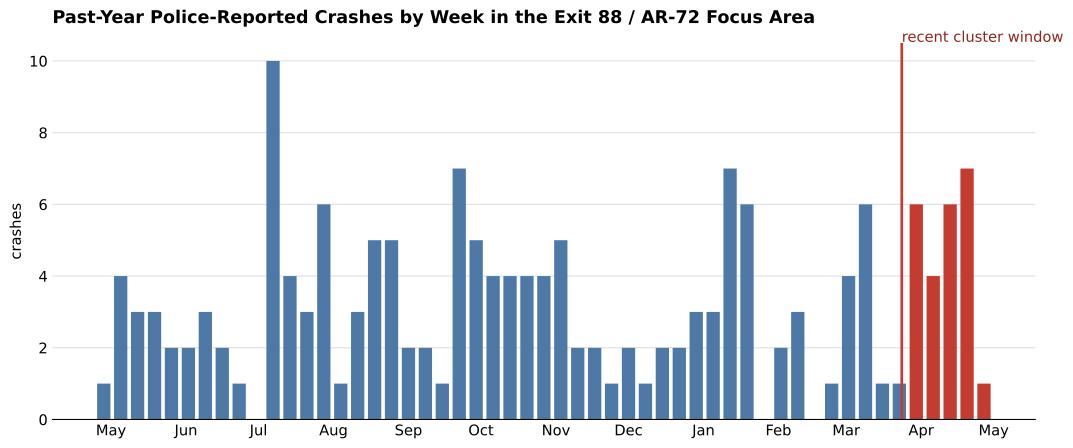
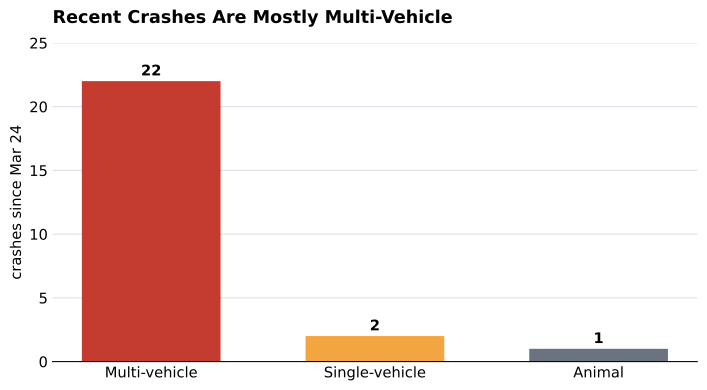
From Mar 24 through the latest local record, the focus area has 93 police-reported crashes. In the full past-year focus-area window, there are 175 crashes, including 158 multi-vehicle crashes.
The 35-day window beginning Mar 24 is more than double the immediately preceding 35-day window (93 vs. 12). That is the change worth showing clearly.
The dataset does not identify dump trucks or causation. It supports a narrower claim: current police-reported crashes cluster around the exact corridor where additional heavy-truck exit movements would add turning and merging conflicts.
Year-over-year scan
YTD Hotspots: Increase Is Different From Raw Volume
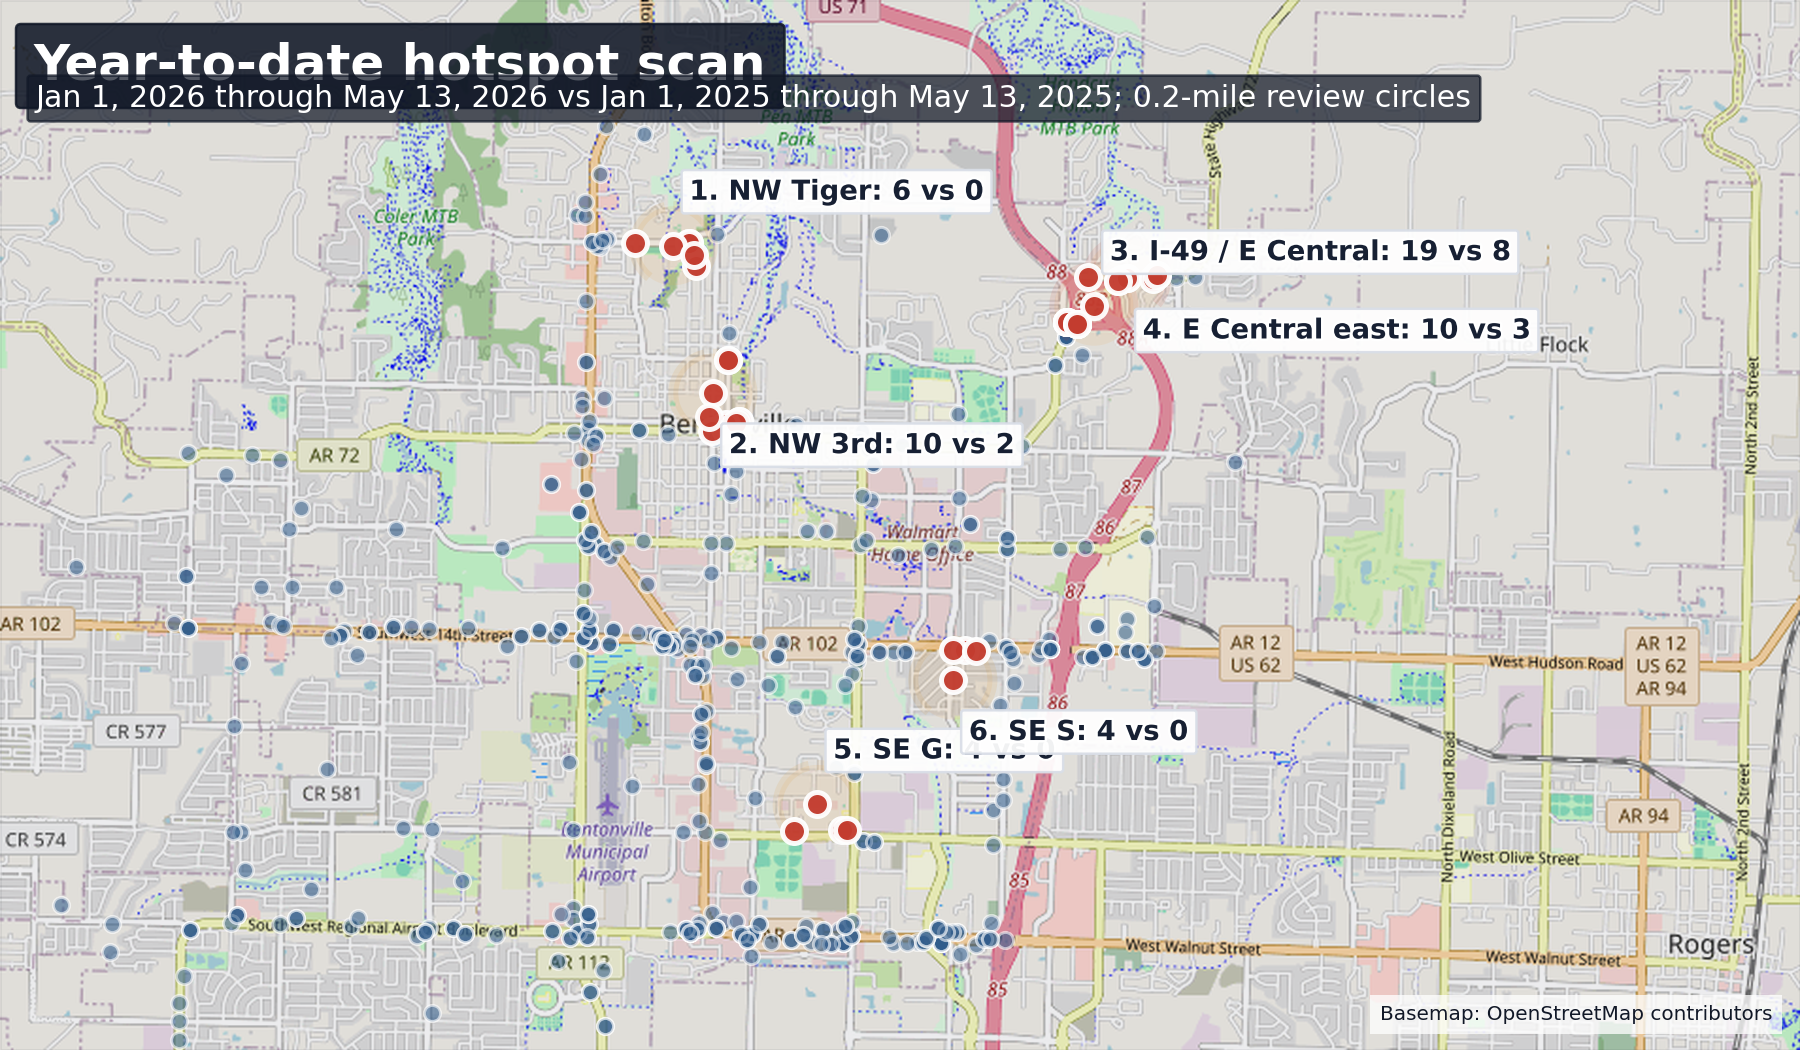
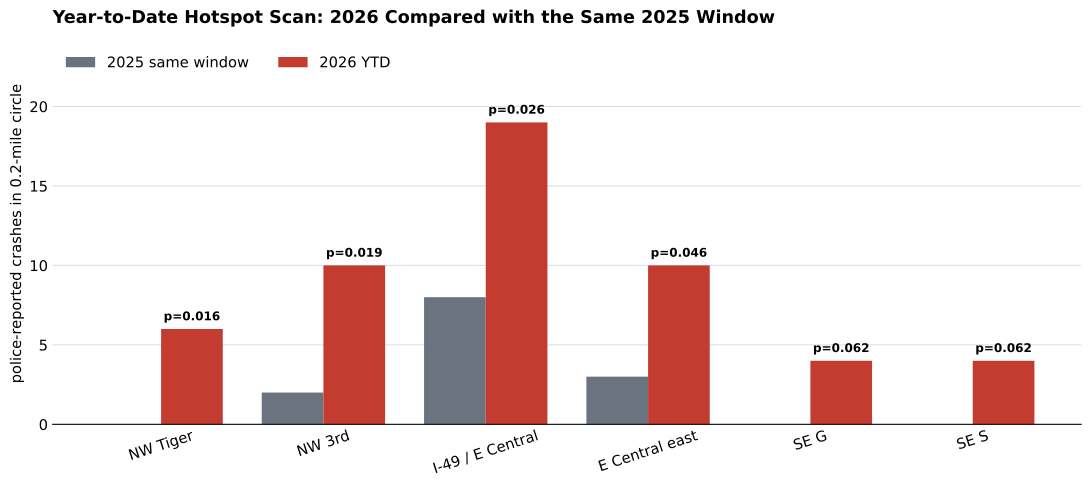
The scan compares Jan 1, 2026 through Sep 15, 2026 with Jan 1, 2025 through Sep 15, 2025 in compact 0.2-mile circles around current-year crash locations. This table is ranked by year-over-year signal, not raw citywide volume: I-49 / East Central has the largest 2026 count and absolute increase among the highlighted year-over-year hotspots, while other arterial locations have higher cumulative 2026 counts with flatter changes.
1
Other city hotspot
SE S St area
Southeast Bentonville candidate cluster with no matching-window crashes last year; keep as a screening signal because total count is small.
9 2026 YTD
0 2025 same window
+9 increase
p=0.002 exact test
2
Exit 88 focus
East Central Ave / Beau Terre-NE McClain
East of the overpass near Beau Terre and NE McClain; this extends the East Central signal beyond the immediate interchange.
20 2026 YTD
7 2025 same window
+13 increase
p=0.010 exact test
3
Other city hotspot
SE G St area
Southeast Bentonville candidate cluster with no matching-window crashes last year; keep as a screening signal because total count is small.
9 2026 YTD
1 2025 same window
+8 increase
p=0.011 exact test
4
Exit 88 focus
36.36381, -94.18631
Candidate cluster from the year-to-date spatial scan.
17 2026 YTD
6 2025 same window
+11 increase
p=0.017 exact test
| Area | 2026 YTD | 2025 same window | Increase | Ratio | p-value | Latest 2026 record |
|---|---|---|---|---|---|---|
| SE S St area | 9 | 0 | +9 | 19.0x | 0.002 | Sep 10, 2026 7:22 PM |
| East Central Ave / Beau Terre-NE McClain | 20 | 7 | +13 | 2.73x | 0.010 | Sep 8, 2026 5:03 PM |
| SE G St area | 9 | 1 | +8 | 6.33x | 0.011 | Aug 26, 2026 5:38 PM |
| 36.36381, -94.18631 | 17 | 6 | +11 | 2.69x | 0.017 | Sep 14, 2026 6:22 AM |
| 36.36439, -94.20797 | 12 | 3 | +9 | 3.57x | 0.018 | Sep 8, 2026 4:06 PM |
| NW Tiger Blvd / Walton Blvd area | 10 | 2 | +8 | 4.2x | 0.019 | Jul 6, 2026 10:00 AM |
This is a screening analysis, not a causal model: overlapping 0.2-mile circles are ranked by a one-sided exact test and then suppressed so one location does not dominate the list. It is useful for deciding where to inspect geometry, signal timing, sight lines, turning movements, and enforcement needs.
Cumulative Volume Check
When the same citywide YTD window is ranked by raw 2026 crash volume, the top representative 0.2-mile circles are mostly Regional Airport and 14th Street arterial locations. I-49 / East Central is therefore not the citywide cumulative-volume leader; its value here is the clearer year-over-year gain inside the Exit 88 focus corridor.
| Area | 2026 YTD | 2025 same window | Change | Latest 2026 record |
|---|---|---|---|---|
| SW Regional Airport Blvd / S Walton Blvd area | 59 | 65 | -6 | Aug 28, 2026 3:17 PM |
| SW 14th St / S Walton Blvd area | 54 | 46 | +8 | Aug 27, 2026 4:16 PM |
| SE Regional Airport Blvd / Moberly-J St area | 52 | 60 | -8 | Sep 11, 2026 9:04 AM |
| SW 14th St / Climb Bentonville area | 40 | 32 | +8 | Aug 17, 2026 7:44 AM |
| SE 14th St / I-49 eastern arterial area | 40 | 43 | -3 | Sep 9, 2026 2:51 PM |
| 36.33564, -94.22244 | 39 | 42 | -3 | Sep 7, 2026 3:26 PM |
These cumulative-volume rows use the same 0.2-mile radius, then suppress nearby candidates at 0.4 miles so adjacent circles do not repeat the same cluster.
Mapped evidence
Where the Cluster Is
The default map shows the past-year focus-area crash layer. Switch to the recent cluster window or filter by crash type to inspect the current concern.
Focus-Area Events
Time window
Crash type
175 visible Sep 15, 2025 through Sep 15, 2026 crash events
Multi-vehicle crash
Single-vehicle crash
Animal crash
Landmark / review radius

Corridor detail
Region Detail
Counts are police-reported accidents from the cleaned historical data refresh. The latest citywide accident record in the data is Sep 15, 2026 5:45 PM.
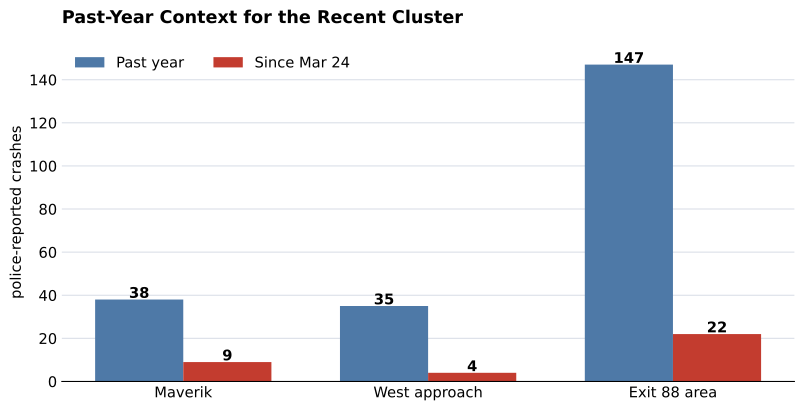
| Area | Radius | Past year | Since Mar 24 | Since Apr 13 | Multi-vehicle | Latest record |
|---|---|---|---|---|---|---|
| Maverik / East Central hotspot | 0.2 mi | 35 | 17 | 15 | 17 | Jul 21, 2026 5:33 PM |
| West side of overpass approach | 0.5 mi | 33 | 16 | 14 | 15 | Sep 10, 2026 8:55 AM |
| Exit 88 / AR-72 1-mile area | 1.0 mi | 142 | 75 | 65 | 69 | Sep 14, 2026 6:22 AM |
Near-Term Actions to Consider
The data justifies an immediate operations review before adding or expanding heavy-truck movements through the corridor.
Require a haul-route and turning-movement plan for dump trucks using the overpass/intersection area, with restricted hours if needed.
Use short-duration video or field observation at Maverik, Casey's, East Central, and the west-overpass approach during peak construction traffic.
Consider warning signage, enforcement presence, flagging, or temporary channelization while the late-April crash pattern is reviewed.
Recent records
Recent Police-Reported Crashes
Most recent records in the focus area, newest first.
| Date | Category | Coordinates | Ticket IDs |
|---|---|---|---|
| Sep 14, 2026 6:22 AM | 2 Multiple vehicle | 36.362288, -94.183764 | 30356 |
| Sep 10, 2026 8:55 AM | 2 Multiple vehicle | 36.369272, -94.197512 | 30349 |
| Sep 10, 2026 7:33 AM | 2 Multiple vehicle | 36.363548, -94.190127 | 30344 |
| Sep 9, 2026 2:56 PM | 2 Multiple vehicle | 36.363854, -94.183345 | 30331 |
| Sep 8, 2026 5:03 PM | 2 Multiple vehicle | 36.383467, -94.170095 | 30334 |
| Sep 8, 2026 8:22 AM | 2 Multiple vehicle | 36.370613, -94.182815 | 30335 |
| Sep 8, 2026 8:14 AM | 2 Multiple vehicle | 36.371144, -94.179993 | 30330 |
| Sep 3, 2026 1:05 PM | 2 Multiple vehicle | 36.370985, -94.183168 | 30310 |
| Aug 28, 2026 4:30 PM | 2 Multiple vehicle | 36.362071, -94.196864 | 30293 |
| Aug 28, 2026 4:15 PM | 2 Multiple vehicle | 36.383331, -94.173244 | 30287 |
| Aug 20, 2026 8:18 AM | 2 Multiple vehicle | 36.365546, -94.186743 | 30261 |
| Aug 20, 2026 8:08 AM | 2 Multiple vehicle | 36.371214, -94.181987 | 30246 |
| Aug 19, 2026 10:53 PM | 2 Multiple vehicle | 36.364121, -94.203167 | 30233 |
| Aug 18, 2026 8:13 AM | 2 Multiple vehicle | 36.383708, -94.168689 | 30245 |
| Aug 16, 2026 6:30 AM | 2 Multiple vehicle | 36.370046, -94.199105 | 30218 |
| Aug 14, 2026 4:29 PM | 2 Multiple vehicle | 36.363701, -94.194528 | 30215 |
Downloads
Public Materials
These static files are served directly by Vercel and can be linked from council packets, emails, or follow-up analysis.
Browser slideshowFull-screen briefing deck for the current Exit 88 analysis.
PDF deckPrintable version of the same council briefing.
Summary JSONMetrics, regions, latest records, and mapped point lists.
Past-year GeoJSONFocus-area crash points for the latest one-year window.
Recent GeoJSONMapped focus-area crash points for GIS review.